Source Data
- Using the Human Error Rates in a previous post.
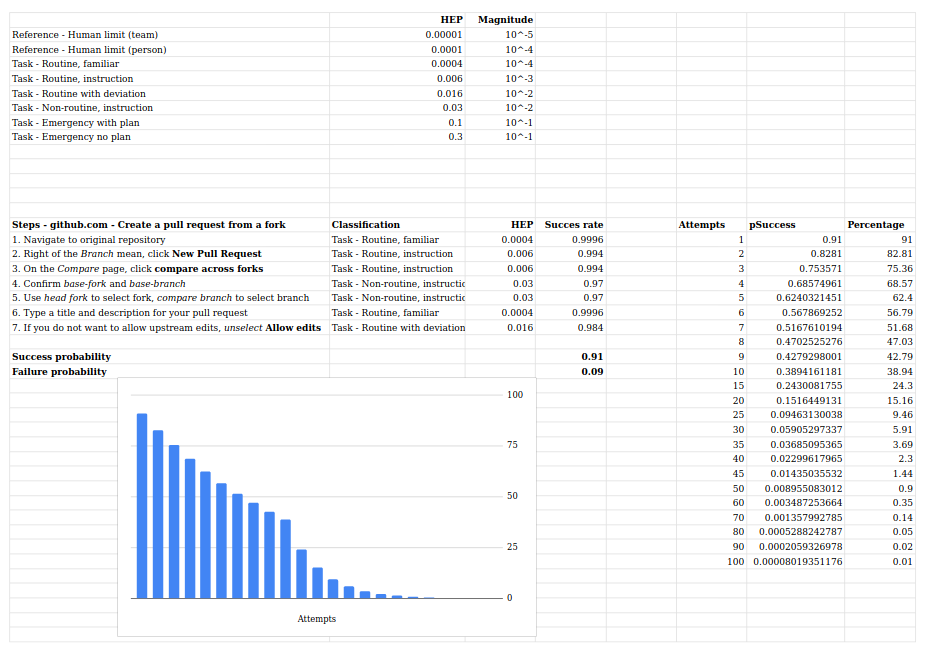
- Example - github.com - Creating a pull request from a fork
Process
1 - List the steps
- Navigate to original repository
- Right of the Branch mean, click New Pull Request
- On the Compare page, click compare across forks
- Confirm base-fork and base-branch
- Use head fork to select fork, compare branch to select branch
- Type a title and description for your pull request
- If you do not want to allow upstream edits, unselect Allow edits
2 - Classify the steps and add error rates
| Steps | Classification | Error rate |
|---|---|---|
| 1. Navigate to original repository | Routine, familiar | 0.0004 |
| 2. Right of the Branch mean, click New Pull Request | Routine, instruction | 0.0060 |
| 3. On the Compare page, click compare across forks | Routine, instruction | 0.0060 |
| 4. Confirm base-fork and base-branch | Non-routine, instruction | 0.0300 |
| 5. Use head fork to select fork, compare branch to select branch | Non-routine, instruction | 0.0300 |
| 6. Type a title and description for your pull request | Routine, familiar | 0.0004 |
| 7. If you do not want to allow upstream edits, unselect Allow edits | Routine with deviation | 0.0160 |
3 - Add success rate
| Steps | Classification | Error rate (pError) | Success Rate (1 - pError) |
|---|---|---|---|
| 1. | Routine, familiar | 0.0004 |
0.9996 |
| 2. | Routine, instruction | 0.0060 |
0.9940 |
| 3. | Routine, instruction | 0.0060 |
0.9940 |
| 4. | Non-routine, instruction | 0.0300 |
0.9700 |
| 5. | Non-routine, instruction | 0.0300 |
0.9700 |
| 6. | Routine, familiar | 0.0004 |
0.9996 |
| 7. | Routine with deviation | 0.0160 |
0.9840 |
4 - Calculate probability of success
Take the product of the success rates to find to likelihood of all steps being completed successfully.
In Excel, Google Sheets,
=ROUND(PRODUCT(pSuccess1:pSuccess7), 2)
For this sequence of steps the likelihood of success is 0.91, or 91%.
Apply for number of likely iterations (e.g. 10) using
=BINOMDIST(10, 10, .91, FALSE)
Example
Download example spreadsheet,