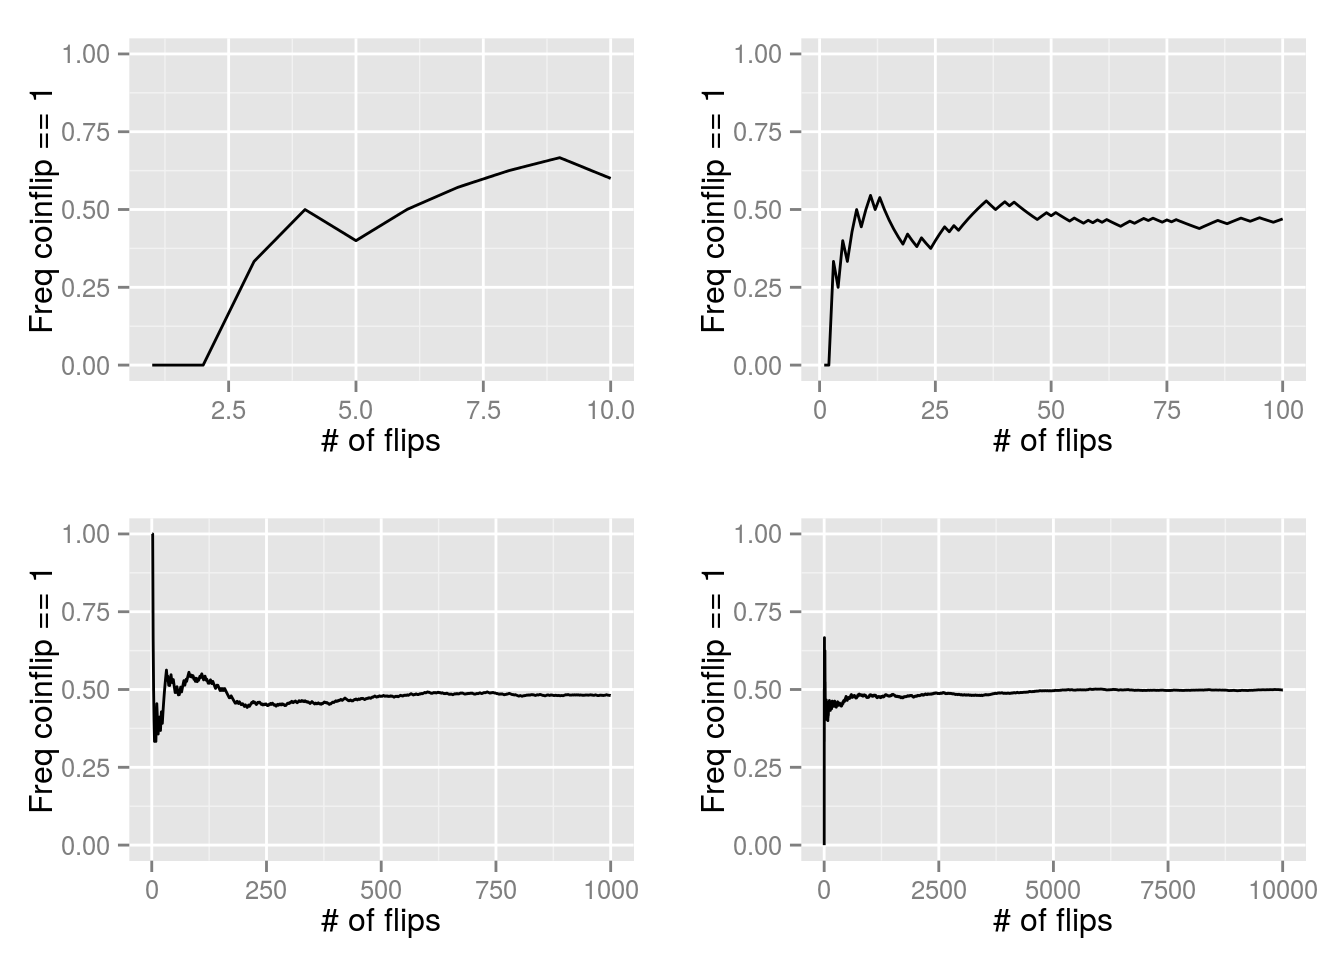
Code
library(ggplot2)
library(gridExtra)
set.seed(1)
coin <- c(0,1)

flipCoin <- function(num_flips=1000) {
  sample(coin, size=num_flips, replace=TRUE)
}

flipEstimate <- function(flips) {
  sum(flips==1) / length(flips)
}

plotFlips <- function(coinflips) {
  qplot(
    1:length(coinflips),
    cumsum(coinflips==1) / (1:length(coinflips)),
    geom='line',
    ylim=coin,
    xlab = '# of flips',
    ylab = 'Freq coinflip == 1'
  )
}
g1 <- plotFlips(flipCoin(10))
g2 <- plotFlips(flipCoin(100))
g3 <- plotFlips(flipCoin(1000))
g4 <- plotFlips(flipCoin(10000))

grid.arrange(g1, g2, g3, g4, ncol=2)
Plot

