Requirements for tools and documentation
- Open source tooling
- Editable with
vim,emacs, etc - Suitable for version control
- Suitable for scripting
Types of documentation
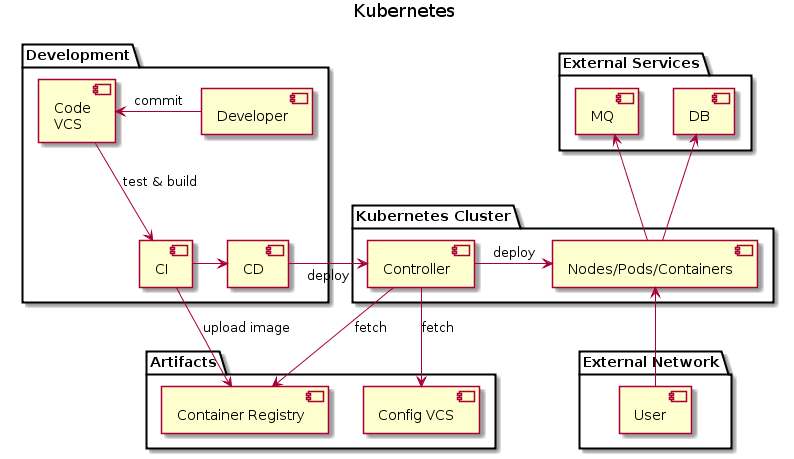
Component diagrams
Preferred tool : PlantUML
Note PlantUML requires graphviz to be installed to generate component diagrams.
# Command line
PLANTUML=~/Downloads/plantuml.jar
java -jar $PLANTUML -v -tpng src/k8s-runtime.uml -o ../out/
@startuml

title Kubernetes
skinparam componentStyle uml2

package "Development" {
  component Developer
  component [Code\nVCS] as VCS
  component CI
  component CD
}

package "External Services" {
  component MQ
  component DB
}

package "Kubernetes Cluster" {
  component "Nodes/Pods/Containers" as Service
  component [Controller] as Controller
}

package Artifacts {
  component [Container Registry] as Registry
  component [Config VCS] as Config
}

package "External Network" {
  component [User] as WebBrowser
}

Developer -l-> VCS : commit
VCS -d-> CI : test & build
CI -r-> CD
CI -d-> Registry : upload image
CD -r-> Controller : deploy

WebBrowser -u-> Service

Service -u-> MQ
Service -u-> DB

Controller -r-> Registry : fetch
Controller -d-> Config : fetch

Controller -l-> Service : deploy

@enduml
Useful parameters for Component Diagrams
skinparam componentType uml2

skinparam linetype splines
skinparam linetype ortho
skinparam linetype polyline
Sequence diagrams
Preferred tool : PlantUML
Note: PlantUML can generate sequence diagrams using only the plantuml.jar file.
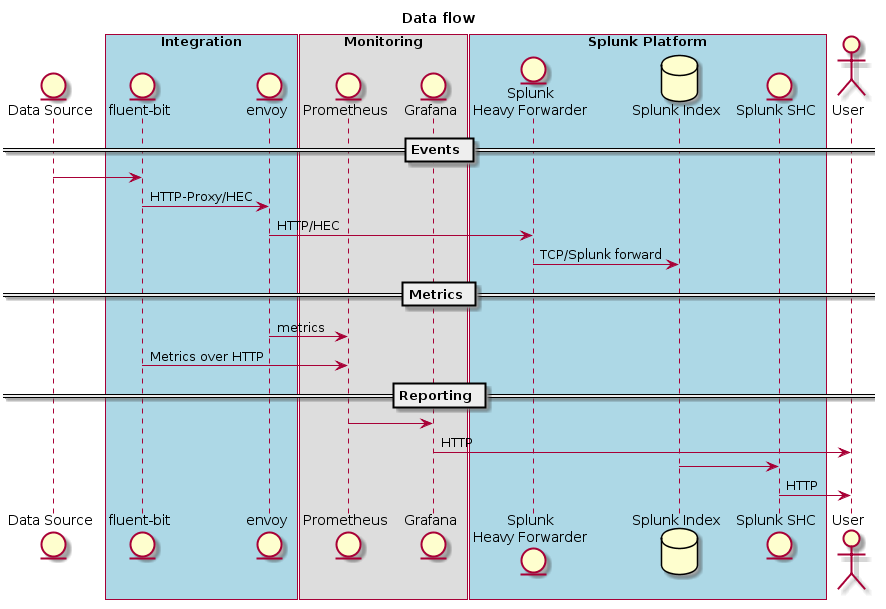
@startuml

title Data flow

entity "Data Source" as DataSource

box "Integration" #lightblue
  entity "fluent-bit" as fluentbit
  entity "envoy" as envoy
end box

box "Monitoring"
  entity "Prometheus" as Prometheus
  entity "Grafana" as Grafana
end box

box "Splunk Platform" #lightblue
  entity "Splunk\nHeavy Forwarder" as HF
  database "Splunk Index" as IDX
  entity "Splunk SHC" as SHC
end box

actor "User" as User

== Events ==

DataSource -> fluentbit
fluentbit -> envoy : HTTP-Proxy/HEC
envoy -> HF : HTTP/HEC
HF -> IDX : TCP/Splunk forward

== Metrics ==

envoy -> Prometheus : metrics
fluentbit -> Prometheus : Metrics over HTTP

== Reporting ==

Prometheus -> Grafana
Grafana -> User : HTTP
IDX -> SHC
SHC -> User : HTTP

@enduml
Timing diagrams
Preferred tool : PlantUML
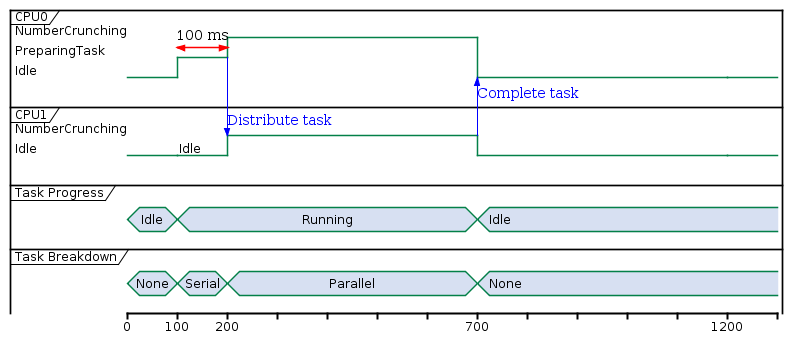
@startuml

robust "CPU0" as CPU0
robust "CPU1" as CPU1
concise "Task Progress" as TaskProgress
concise "Task Breakdown" as TaskBreakdown

@0
TaskProgress is Idle
TaskBreakdown is None
CPU1 is Idle
CPU0 is Idle

@100
TaskProgress is Running
TaskBreakdown is Serial
CPU0 is PreparingTask
CPU1 is Idle : Idle

CPU0@100 <-> @200 : 100 ms

@200
TaskBreakdown is Parallel
CPU0 is NumberCrunching
CPU0 -> CPU1 : Distribute task
CPU1 is NumberCrunching

@700
TaskProgress is Idle
TaskBreakdown is None
CPU1 -> CPU0 : Complete task
CPU0 is Idle
CPU1 is Idle

@1200
CPU0 is Idle
CPU1 is Idle
@enduml
Graph visualization
Preferred tool : Graphviz
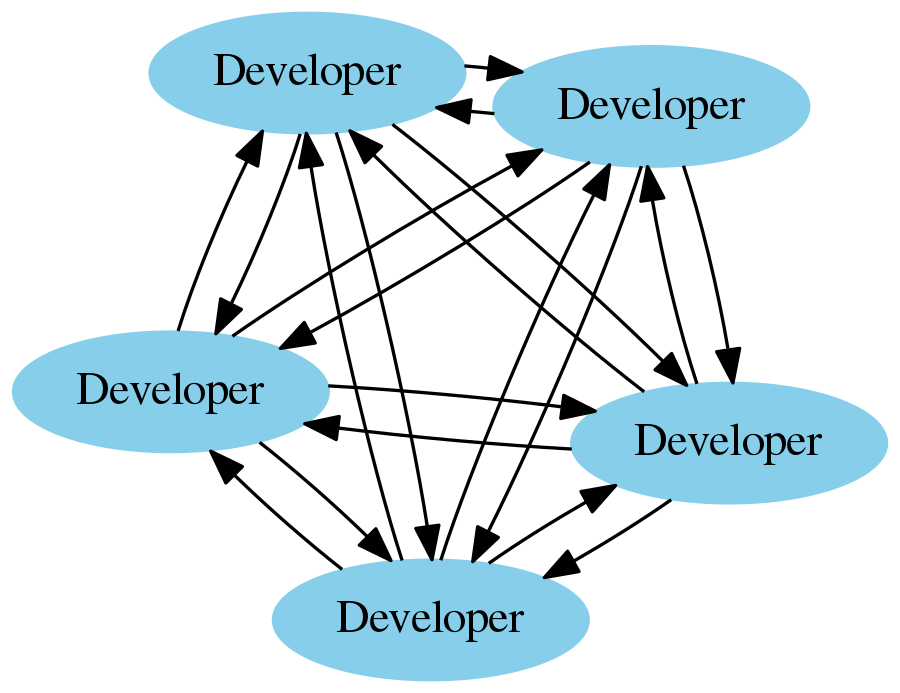
~$ neato src/graph-cohesion.dot -Tpng -o out/graph-cohesion.png
digraph G {

  {node [label="Developer" style=filled color=skyblue] d1 d2 d3 d4 d5 }

  d1 -> d2 [len=2];
  d1 -> d3 [len=2];
  d1 -> d4 [len=2];
  d1 -> d5 [len=2];

  d2 -> d1 [len=2];
  d2 -> d3 [len=2];
  d2 -> d4 [len=2];
  d2 -> d5 [len=2];

  d3 -> d1 [len=2];
  d3 -> d2 [len=2];
  d3 -> d4 [len=2];
  d3 -> d5 [len=2];

  d4 -> d1 [len=2];
  d4 -> d2 [len=2];
  d4 -> d3 [len=2];
  d4 -> d5 [len=2];

  d5 -> d1 [len=2];
  d5 -> d2 [len=2];
  d5 -> d3 [len=2];
  d5 -> d4 [len=2];

}
Flow charts
Preferred tool : PlantUML
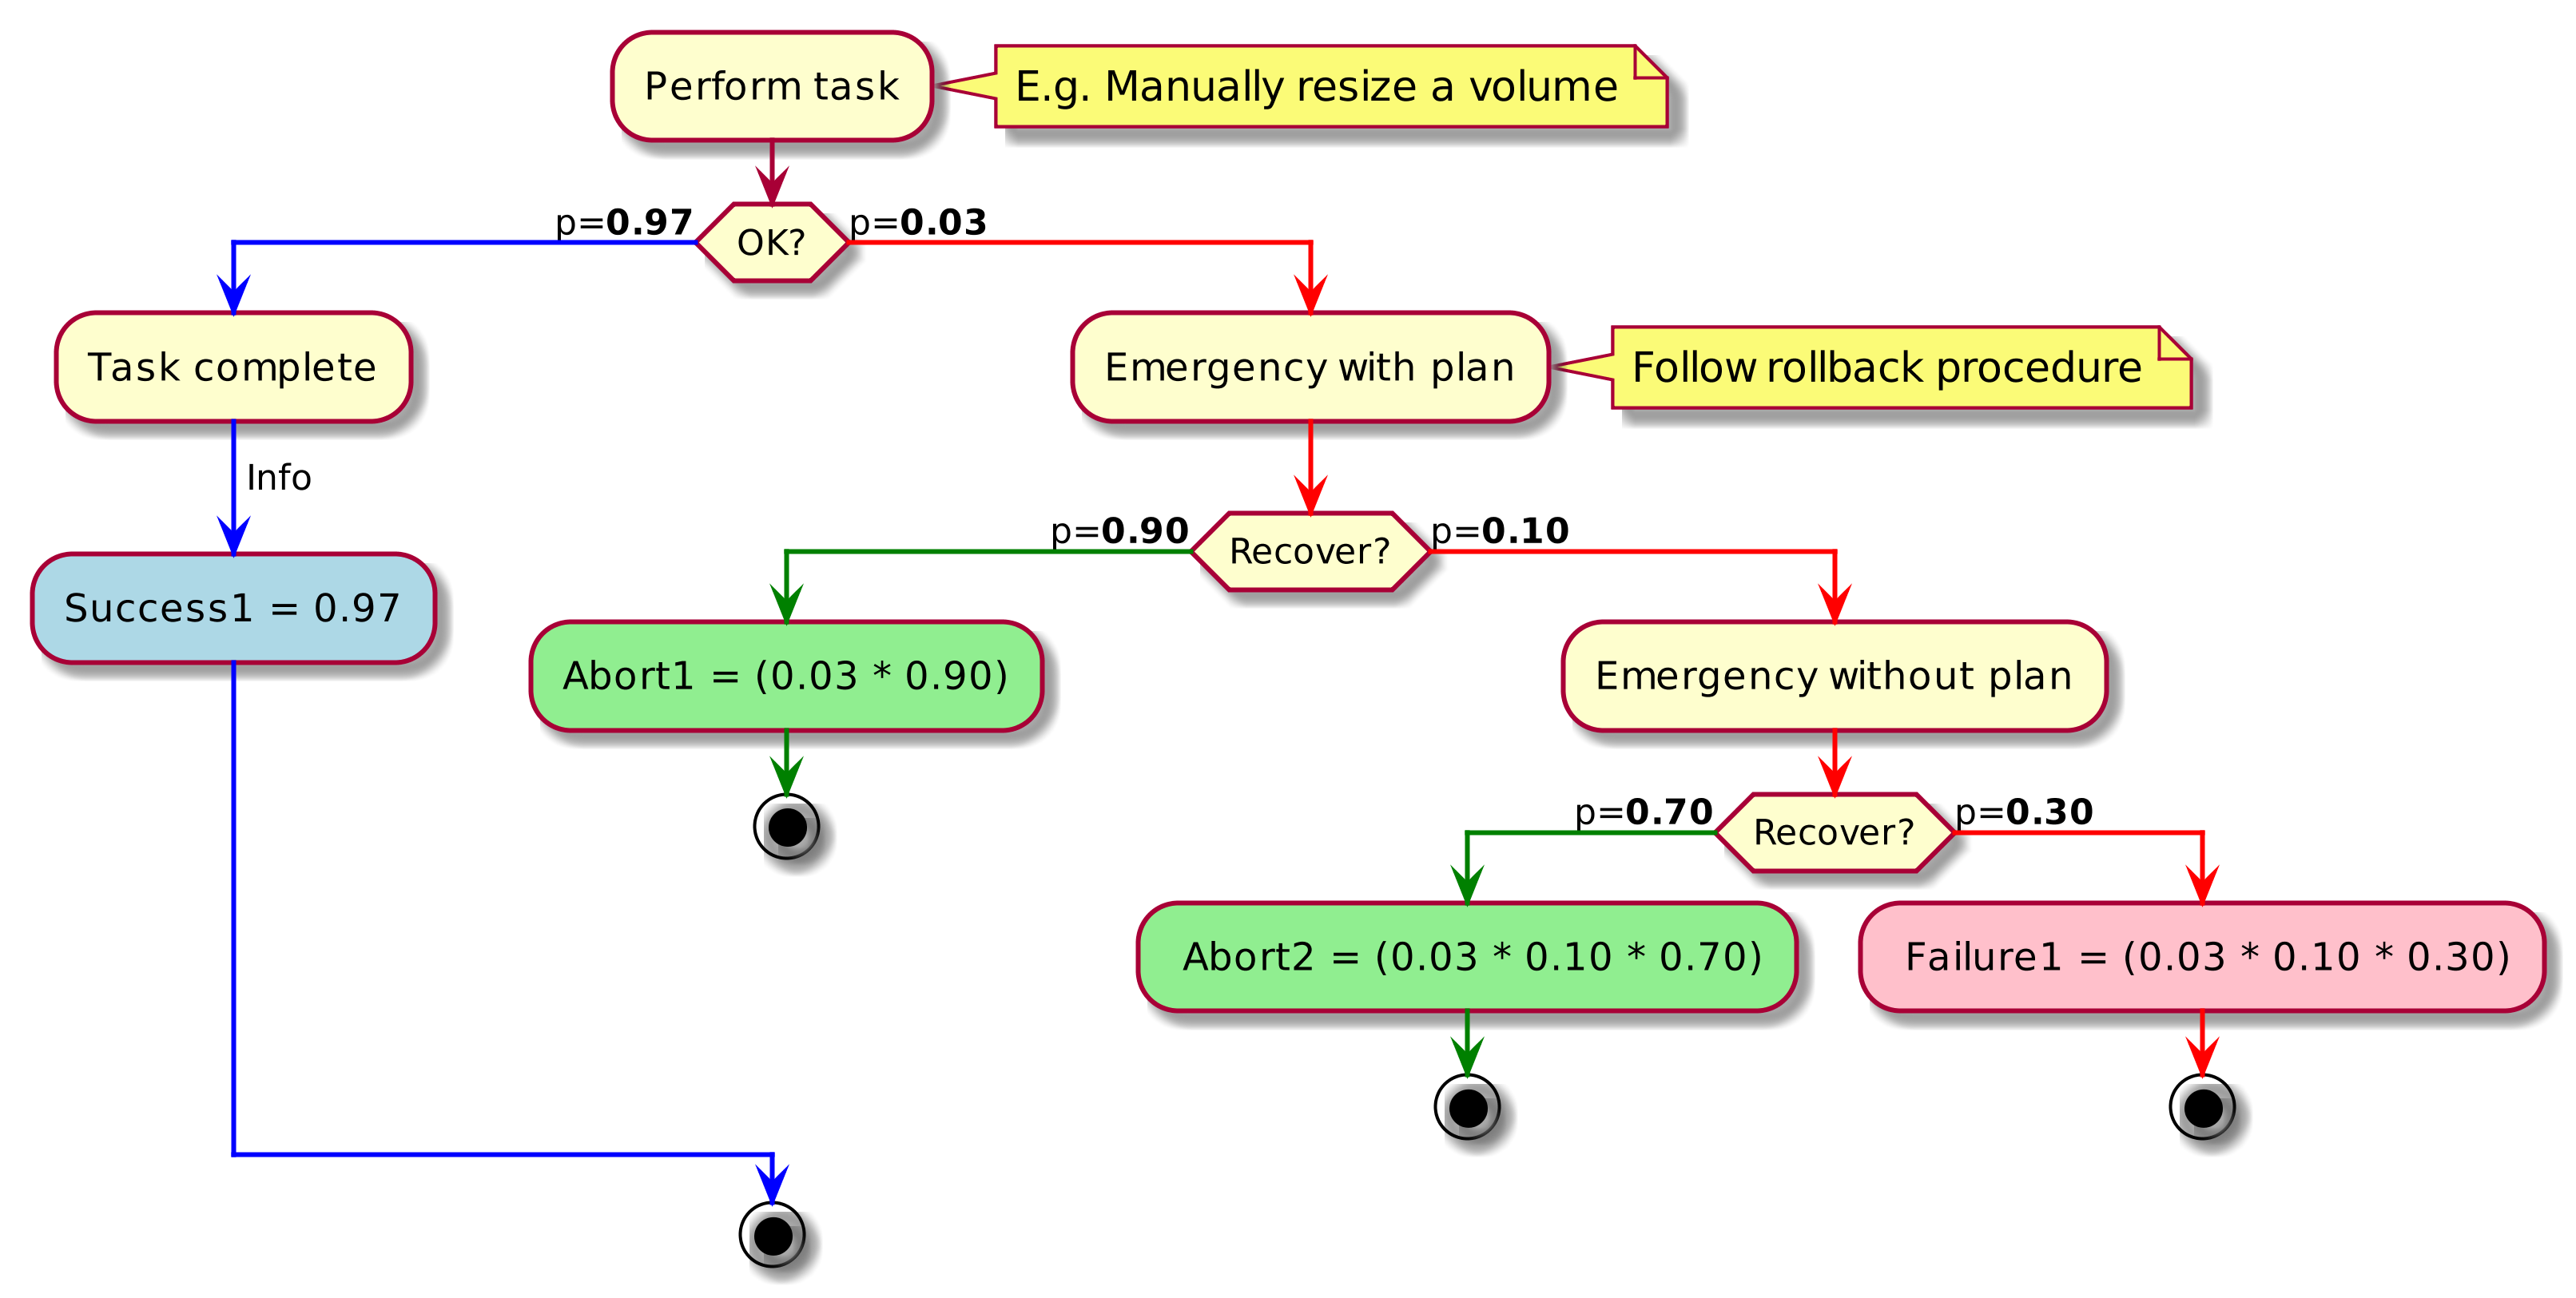
@startuml

scale 4

:Perform task;
note right
E.g. Manually resize a volume
end note
->
if (OK?) then
  -[#blue]-> p=**0.97**;
  :Task complete;
  -[#blue]-> Info;
  #Lightblue:Success1 = 0.97;
  -[#blue]->
else
  -[#red]-> p=**0.03**;
  :Emergency with plan;
  note right: Follow rollback procedure
  -[#red]->
  if (Recover?) then
    -[#green]-> p=**0.90**;
    #Lightgreen:Abort1 = (0.03 * 0.90);
    -[#green]->
    stop
  else
    -[#red]-> p=**0.10**;
    :Emergency without plan;
    -[#red]->
    if (Recover?) then
      -[#green]-> p=**0.70**;
      #Lightgreen: Abort2 = (0.03 * 0.10 * 0.70);
      -[#green]->
      stop
    else
      -[#red]-> p=**0.30**;
      #Pink: Failure1 = (0.03 * 0.10 * 0.30);
      -[#red]->
      stop
    endif
  endif
endif
-[#blue]->;
stop

@enduml
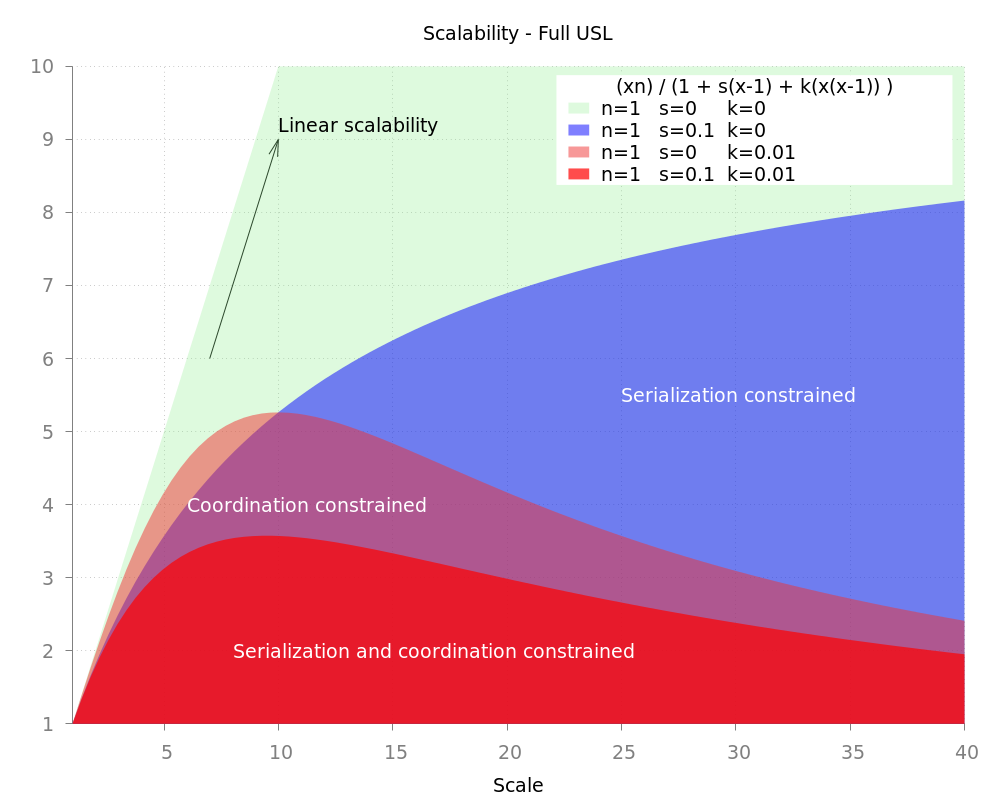
Plotting
Preferred tool : gnuplot
~$ gnuplot src/plot-usl-001.gnuplot
set terminal pngcairo size 1000,800 enhanced font 'Verdana,14'
set output 'out/plot-usl-001.png'
set border linewidth 1.5
set title "Scalability - Full USL"

set ylabel 'Work'
set xlabel 'Scale'

# Axes
set style line 11 lc rgb '#808080' lt 1
set border 3 back ls 11
set tics nomirror out scale 0.75

# Grid
set style line 12 lc rgb'#808080' lt 0 lw 1
set grid back ls 12

set style fill noborder
set style function filledcurves y1=0
set clip two

n = 1
s = 0.1 # serialization
k = 0.01 # crosstalk

USL(x, s, k) = (x * n) / (1 + s * (x - 1) + k*(x*(x-1)) )

f1(x) = USL(x, 0, 0)
f2(x) = USL(x, s, 0)
f3(x) = USL(x, s, k)
f4(x) = USL(x, 0, k)

set yrange [1:10]
set xrange [1:40]

unset colorbox
set key opaque
set key title "(xn) / (1 + s(x-1) + k(x(x-1)) )"
set key top right Left reverse samplen 1

set label "Linear scalability" at 10,9.2 front
set arrow from 7,6 to 10,9

set label "Serialization constrained" at 25, 5.5 front textcolor rgbcolor "#ffffff"
set label "Coordination constrained" at 6, 4 front textcolor rgbcolor "#ffffff"
set label "Serialization and coordination constrained" at 8, 2 front textcolor rgbcolor "#ffffff"

set lmargin 6
plot f1(x) fs transparent solid 0.30 lc rgb "light-green" title 'n=1   s=0     k=0', \
     f2(x) fs transparent solid 0.50 lc rgb "blue" title 'n=1   s=0.1  k=0', \
     f4(x) fs transparent solid 0.50 lc rgb "light-red" title 'n=1   s=0     k=0.01', \
     f3(x) fs transparent solid 0.70 lc rgb "red" title 'n=1   s=0.1  k=0.01'
Presentations
Preferred tool : pandoc
pandoc src/presentation.md \
--mathml  \
-t beamer \
--highlight-style espresso \
-o out/presentation.pdf
Reports
Preferred tool : pandoc
pandoc src/report.md \
 -V geometry:margin=1in \
--latex-engine=pdflatex \
--mathml  \
--highlight-style espresso \
-o out/report.pdf